
AI resolution rate vs deflection rate: the metric that decides your program
 Communicate.so
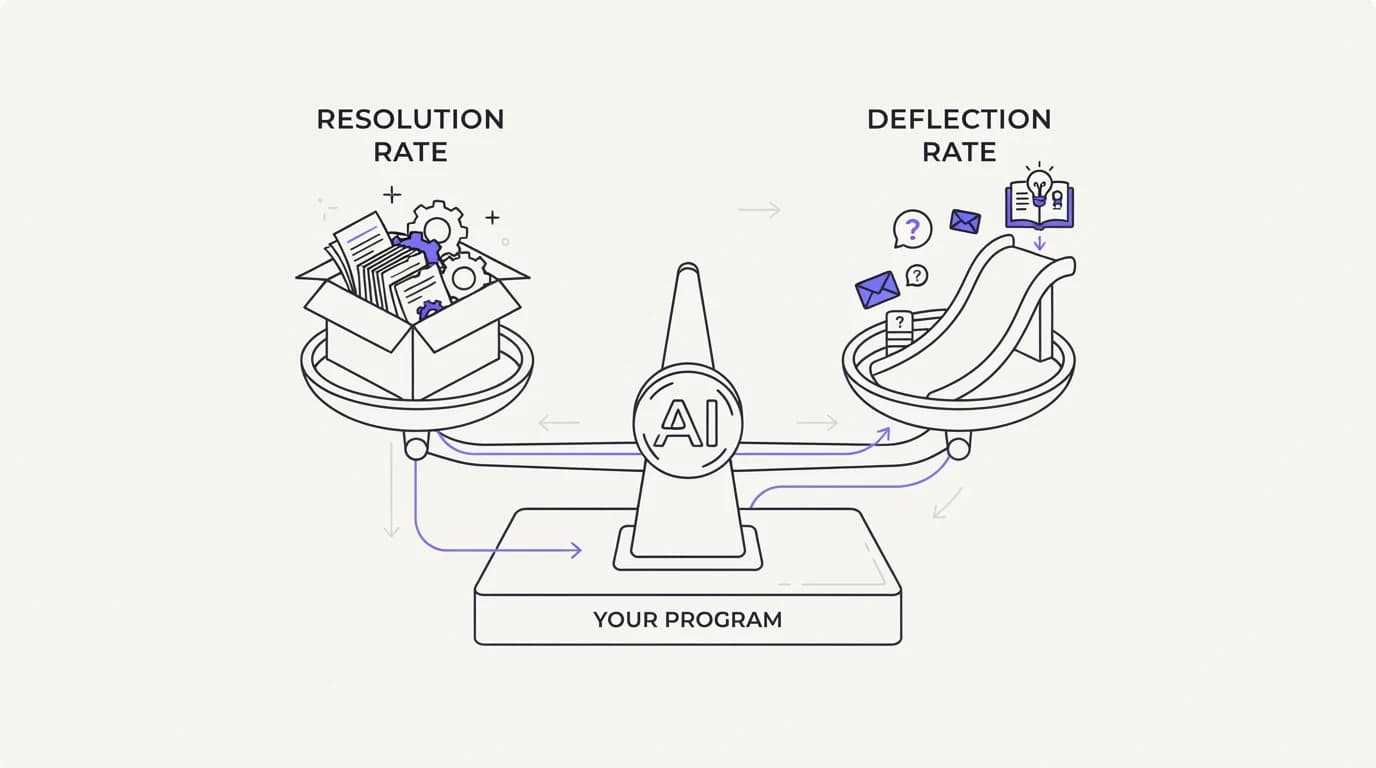
Resolution rate vs deflection rate explained with formulas, denominators, and a worked example showing the same month reads 72% or 38%.
TL;DR: Deflection rate counts conversations an AI agent handled without a human ever touching them. Resolution rate counts problems that were actually solved, checked against repeat contact or explicit confirmation. The two numbers measure different events inside the same conversation, and they routinely disagree by 30 points or more on identical data. This guide gives both formulas, states the denominator each one uses, and walks a worked example where one month of support data reads as 72% deflection or 38% resolution depending only on which definition is applied. It also places the industry's two most cited figures, a 41.2% enterprise deflection median at Zendesk and an 80% marketed deflection claim from Decagon, next to each other so the gap between a pitch deck and a support-ops dashboard stops being a mystery.
A vendor demo says an AI agent resolves 80% of tickets. Your own dashboard, built off the same conversations, says something closer to 40%. Both numbers can be accurate at once, because deflection rate and resolution rate measure two different events in the same conversation, and a figure built on one will not match a figure built on the other.
Support teams that already track a support ticket deflection rate know one half of this argument. This guide is the companion piece that separates deflection from resolution formally, gives the exact formula for each, and shows why the same underlying data can produce two headline numbers that look like they come from different companies.
The goal is not to declare a winner. Deflection rate and resolution rate answer different questions, and a support leader who tracks only one is flying with half the instrument panel. What follows is the mechanism behind each metric, a worked example with clearly labeled illustrative numbers, and a plain method for choosing which one governs your analytics dashboard.
What deflection rate measures
Deflection rate counts the share of conversations that an AI agent handled without a human agent ever touching them. The denominator is every conversation the AI opened. The numerator is every conversation that closed, was marked resolved, or simply ended, without a person stepping in.
The formula is straightforward: deflection rate equals AI-only conversations divided by total conversations the AI engaged. Nothing in that formula checks whether the customer's actual problem got solved. A conversation counts as deflected the moment no human replies, whether the AI gave a correct answer, a vague answer, or no useful answer at all, a gap covered in more detail in reducing AI hallucinations in support.
Deflection rate is popular because it is cheap and immediate to compute. Every helpdesk already logs whether a human replied, so the metric requires no extra instrumentation, no follow-up survey, and no waiting period. That immediacy is exactly why it shows up in vendor marketing far more often than resolution rate does.
The honest limitation is that deflection rate is a workload metric wearing a satisfaction costume. It tells a support leader how much volume left the human queue, which matters for staffing and cost, a subject covered in the cost per ticket benchmark. It does not tell you whether the customer walked away with a solved problem or a closed tab and an unresolved issue.
What resolution rate measures
Resolution rate counts the share of reported problems that were verifiably solved, regardless of whether a human or an AI agent did the solving. The denominator is every problem a customer actually reported. The numerator is every one of those problems confirmed closed, typically checked against a repeat-contact window or an explicit customer confirmation.
The formula: resolution rate equals verified solved problems divided by total problems reported. A verification step is what separates this metric from deflection. A common method is a repeat-contact check, where a conversation only counts as resolved if the same customer does not reopen the same issue within a set window, often three to seven days, an approach Lorikeet documents in its 2026 benchmark work.
Resolution rate is harder to compute than deflection rate because it needs a second pass, either an automated repeat-contact scan or a satisfaction confirmation attached to the conversation. That extra step is also what makes it trustworthy. A conversation cannot inflate a resolution number just because the customer gave up and stopped replying.
The tradeoff is timing. A resolution number for this month is not fully known until the repeat-contact window has closed, which means resolution rate always lags deflection rate by days, sometimes longer for support-ticket-deflection-rate style volume claims made in real time. A team that wants a same-day number will default to deflection, and a team that wants an accurate one waits for resolution to settle.
The two formulas side by side
 Communicate.so
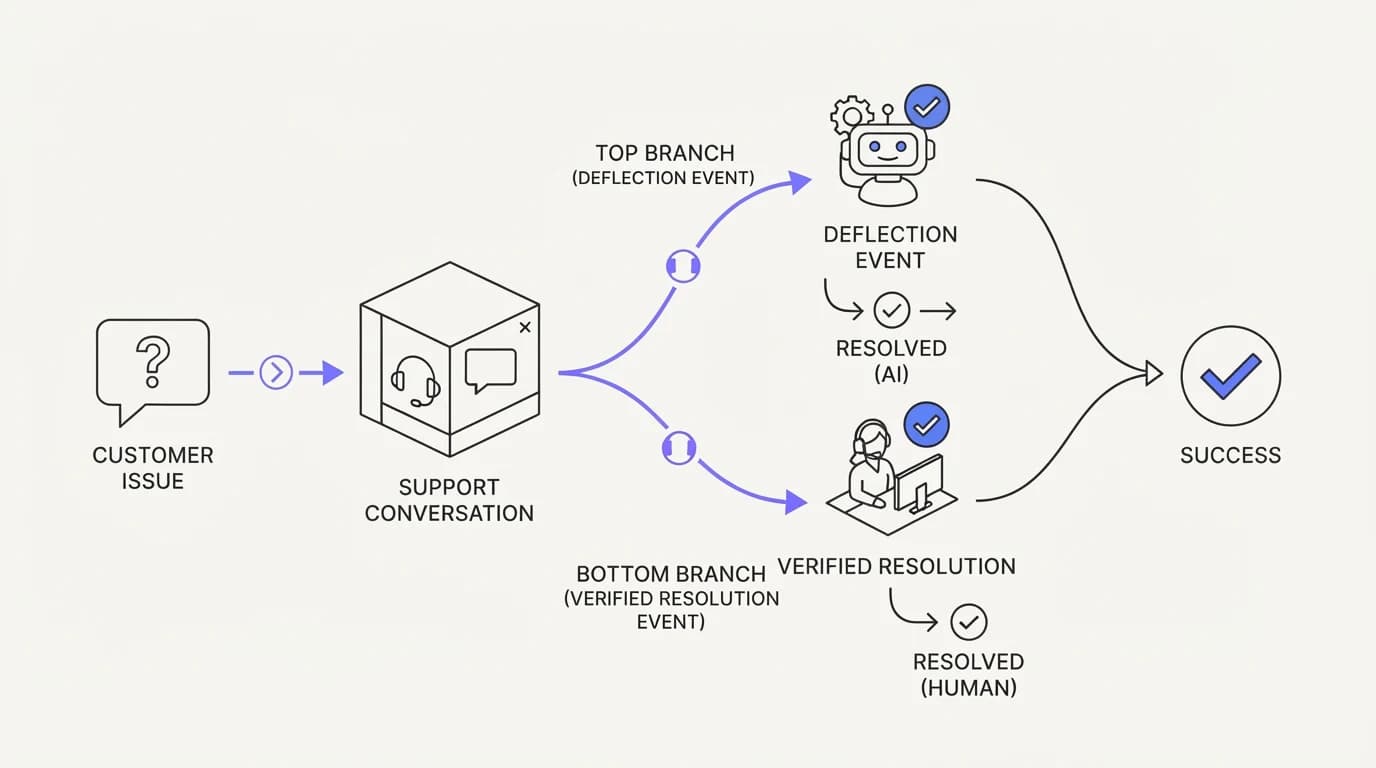
Put the two formulas next to each other and the disagreement stops being surprising. They use different denominators and different numerators, so there is no algebraic reason for them to land on the same number, even when they are computed from the exact same batch of conversations.
| Metric | Formula | Denominator | What it actually counts |
|---|---|---|---|
| Deflection rate | AI-only conversations / total conversations | Every conversation the AI engaged | Conversations a human never touched, regardless of outcome |
| Resolution rate | Verified solved problems / total problems reported | Every problem a customer actually reported | Problems confirmed solved after a repeat-contact or confirmation check |
Read the denominators carefully, because that is where the two metrics diverge before a single conversation is even scored. Deflection rate's denominator includes every conversation, even ones that were never really a distinct problem, like a customer saying thanks twice in the same thread. Resolution rate's denominator counts distinct reported problems, which is a stricter and usually smaller number, a distinction the first response time benchmark guide runs into from the opposite direction when it defines what counts as a first response at all.
Neither formula is wrong. They are built to answer different questions, and the mistake is using one number to answer a question it was never designed for, such as quoting a deflection figure in a customer satisfaction conversation.
A worked example: 72% or 38% from the same month
 Communicate.so
The numbers below are illustrative inputs built to show the mechanism, not a measured result from any customer account. They use round figures on purpose so the arithmetic stays visible.
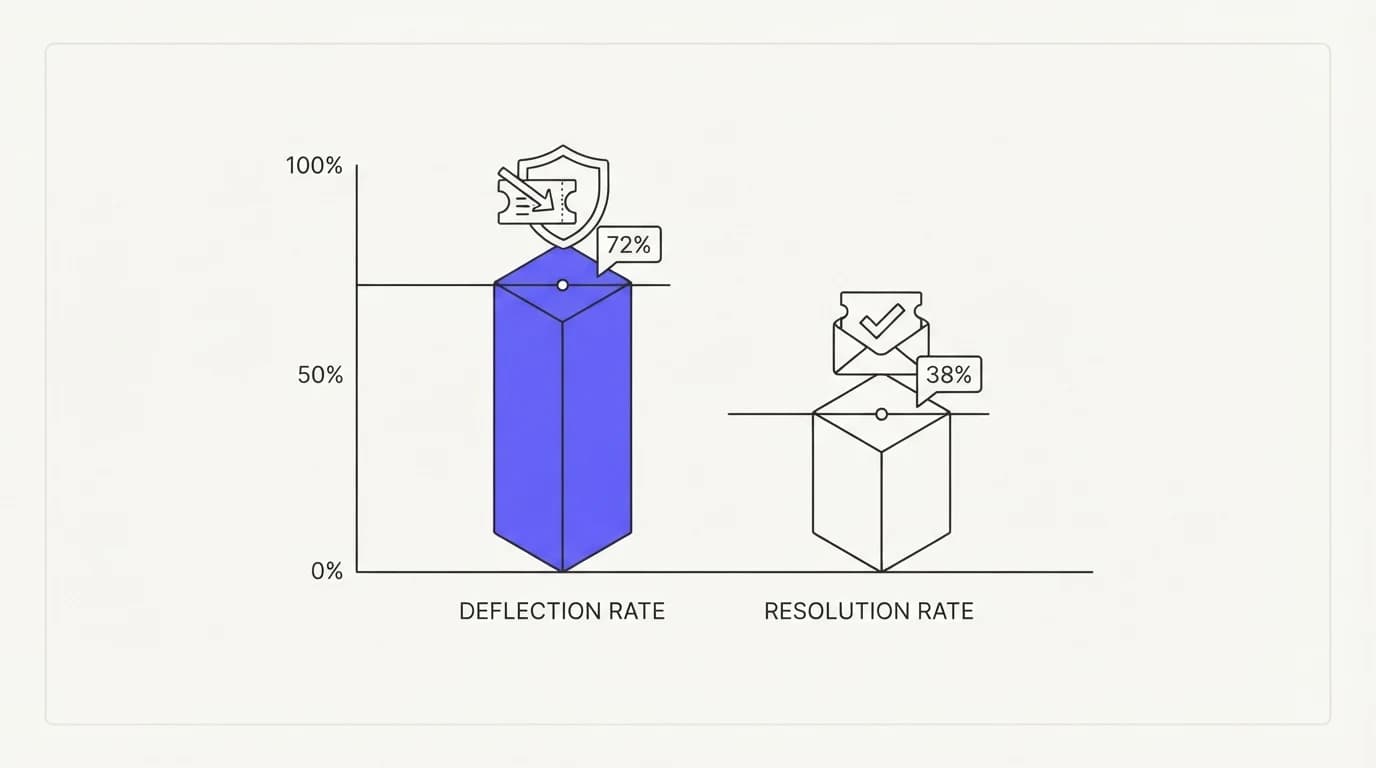
Say a support team logs 10,000 conversations in a month. The AI agent handles all 10,000 on first contact, and in 7,200 of them, no human ever replies. Deflection rate for the month is 7,200 divided by 10,000, which is 72%.
Now run a repeat-contact audit on the same 10,000 problems, checking whether the customer came back with the same issue inside seven days. Of the 7,200 conversations that were deflected, only 3,800 stayed closed. The other 3,400 customers reopened the same issue, either directly or through a new conversation the routing did not link to the original.
Resolution rate for that same month is 3,800 divided by 10,000, which is 38%. Both numbers describe the exact same 10,000 conversations. One says the AI kept humans out of 72% of the workload.
The other says only 38% of reported problems actually stayed solved a week later, a gap this large is exactly why HappySupport and other benchmark trackers report deflection and resolution as two separate series rather than one.
A vendor selling into this account can truthfully say the AI deflected 72% of volume. A support lead auditing the same month can truthfully say only 38% of problems were actually solved. Neither is lying.
They picked different denominators for different purposes, and a reader who does not know which formula produced a number has no way to tell which claim they are looking at.
Why the industry gap runs from 41% to 80%
Real published benchmarks show the same spread as the worked example above. Lorikeet's 2026 research put the Zendesk enterprise median deflection rate at 41.2%, measured across live enterprise accounts. In the same report, Decagon's marketed deflection claim runs as high as 80%, a figure closer to the top end of what a best-case account can hit rather than what a typical account sees ($Lorikeet).
Neither number is fabricated. A marketed claim usually comes from a top-performing customer, a narrow ticket category, or a definition of deflection that leans generous, such as counting a conversation as deflected the moment the AI sends any reply, before the customer has had a chance to come back. An enterprise median comes from the messy middle of a real account book, across every ticket type a company actually receives.
The lesson is not to distrust every published figure. It is to ask which formula produced it, over what denominator, and whether it was a median across accounts or a single best case before comparing it to your own numbers. Adoption pressure makes this gap matter more than it used to: DigitalApplied reports that 66% of service organizations were running AI agents in 2026, up from 39% in 2025, with 91% of CX leaders under executive pressure to deploy, citing Salesforce and Gartner research.
That pressure is exactly the condition under which a generous deflection number gets waved around in a board meeting without anyone asking for the denominator.
How the numbers shift from year one to maturity
 Communicate.so
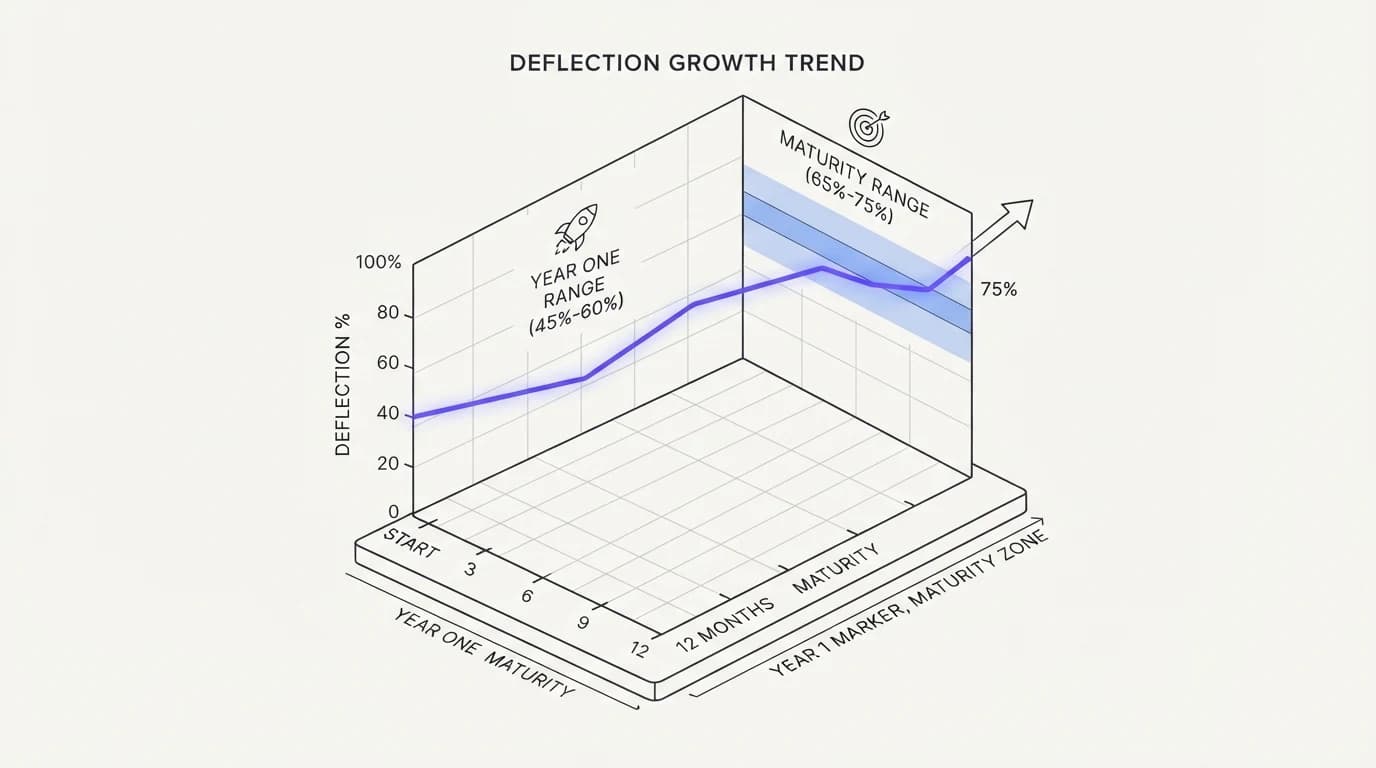
Both metrics move as a program ages, and mistaking one stage for another is a second common way benchmarks get misread. HappySupport's benchmark work puts typical deflection in the 45% to 60% range during a program's first year, climbing to 65% to 75% once an account reaches maturity ($HappySupport).
The climb from year one to maturity is not magic. It comes from content coverage improving as gaps get closed, from guardrails narrowing false-confident answers, and from routing logic learning which ticket types the AI should not attempt. A team reading a maturity-stage 70% figure and expecting to hit it in month two of a rollout is comparing the wrong stage of the curve to their own.
Resolution rate tends to climb more slowly than deflection rate during this same window, because early deflection gains often come from easy, low-risk categories where a correct answer is easy to give and easy to verify. The harder categories, the ones where a wrong answer is expensive, are usually the last to move, which is one reason AI agent guardrails matter more in month one than month twelve, when the AI is still learning where its own confidence should be lower.
A practical habit follows from this. Track both curves separately by month, not just the current snapshot, and expect the gap between deflection and resolution to narrow as a program matures rather than expecting either number alone to tell the whole story on day one.
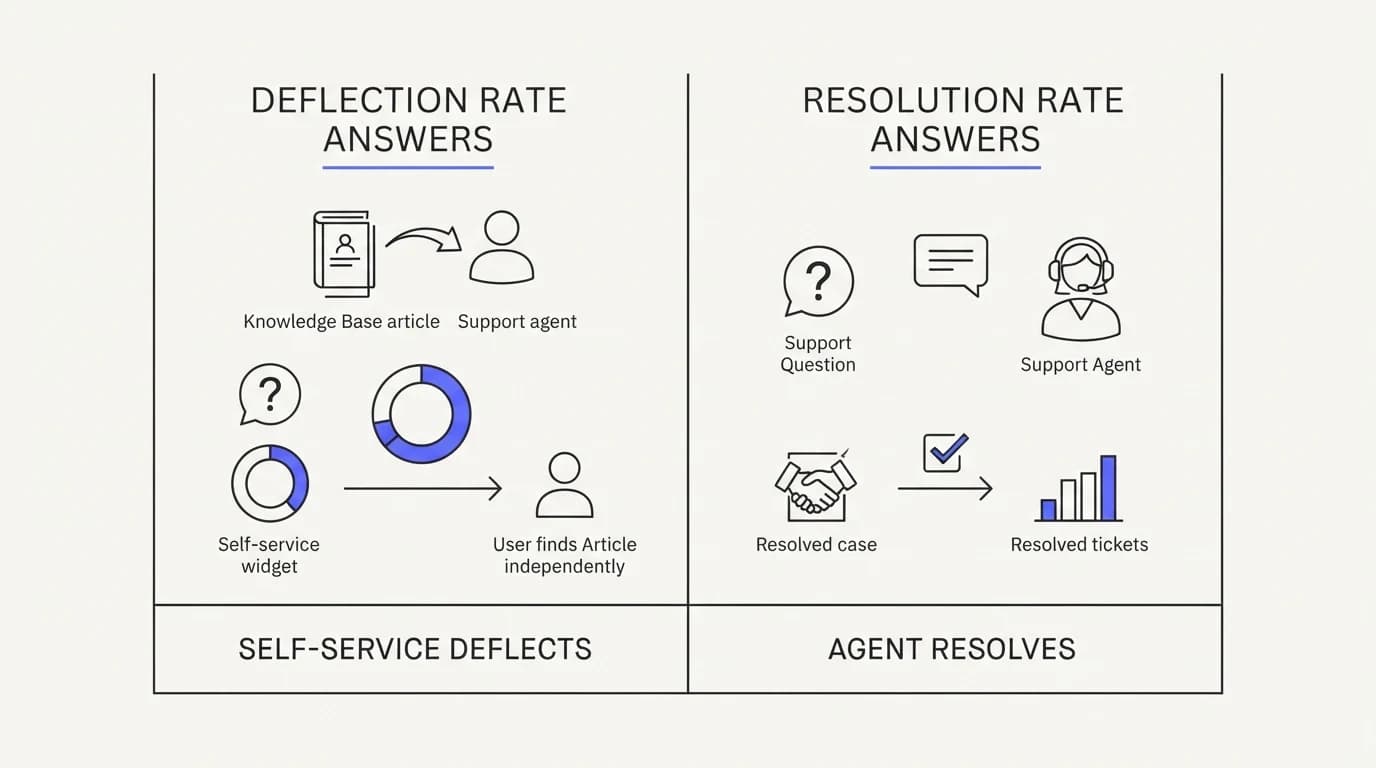
The comparison table: what each metric hides
 Communicate.so
| Question a leader asks | Deflection rate answers it | Resolution rate answers it |
|---|---|---|
| Did the AI reduce agent workload this month | ✓ | ✗ |
| Did the customer's actual problem get solved | ✗ | ✓ |
| Can a vague or wrong answer still count as a win | ✓ | ✗ |
| Does a same-week repeat contact get subtracted | ✗ | ✓ |
| Is the number available same day | ✓ | ✗ |
| Does it need a repeat-contact or confirmation audit | ✗ | ✓ |
| Is it safe to quote in a satisfaction or trust conversation | ✗ | ✓ |
| Is it useful for staffing and cost forecasting | ✓ | ✗ |
Neither column is the correct one to always pick. A staffing forecast genuinely needs deflection rate, because payroll planning cares about workload leaving the queue, a link between the two subjects the cost per ticket benchmark walks through directly. A customer trust conversation needs resolution rate, because a customer does not care how few humans were involved, only whether their problem is actually gone.
Choosing the metric that matches your incentive
The practical rule is to name the decision before picking the metric. If the question is how much a support team can shrink or redeploy, deflection rate is the right instrument, because it measures exactly the workload question being asked.
If the question is whether customers are actually being helped, resolution rate is the only honest answer, because it is the one metric in this pair that checks the outcome rather than the handoff. A leadership team that reports deflection rate in a board deck as a proxy for quality is quietly answering a question nobody asked, and a customer success team that reports it as a proxy for satisfaction is making the same mistake in the other direction, a confusion the customer support CSAT benchmark guide untangles from the satisfaction side.
The safest operating model tracks both numbers permanently, side by side, on the same dashboard, rather than picking a favorite. A widening gap between the two is itself a signal worth investigating, because it usually means the AI is closing conversations that are not staying closed.
Set a repeat-contact window before you start measuring, not after you see a number you like. A seven-day window is a defensible, commonly used default, and it should stay fixed across months so trend comparisons over time in your analytics stay apples to apples.
Where Communicate fits, honestly
Communicate reports resolution alongside deflection rather than only the flattering half. The analytics dashboard tracks AI-only conversation volume and pairs it with a repeat-contact check, so a support lead can see both the 72% and the 38% in the worked example above, not just the number a pitch deck would lead with.
The AI agent itself is built on the retrieval-and-refuse pattern rather than a model that guesses when it is unsure. That design choice matters more for resolution rate than deflection rate, because a model that fabricates a confident but wrong answer inflates deflection while quietly wrecking resolution.
Here is the honest limit. Communicate does not publish a universal deflection or resolution percentage, because both numbers are shaped by ticket mix, content coverage, and industry, exactly the variables this guide has spent the last several sections explaining. Anyone quoting a single flat number for either metric across all accounts is doing the same generous-denominator trick this guide is warning against.
You can see how the underlying agent behaves on pricing, including the one-time $1 activation that includes 100 test credits to run your own before-and-after audit on real tickets.
Key takeaways
- Deflection rate divides AI-only conversations by total conversations, and it never checks whether the underlying problem got solved.
- Resolution rate divides verified solved problems by total problems reported, using a repeat-contact or confirmation check as the verification step.
- The same month of data can read 72% deflection and 38% resolution at once, because the two formulas use different denominators, not because one number is wrong.
- Published industry figures span a real 41.2% enterprise median to an 80% marketed claim, and the gap usually comes from account selection and formula choice, not fabrication.
- Deflection typically runs 45 to 60% in a program's first year and climbs to 65 to 75% at maturity, so compare benchmarks against the right stage of the curve.
Want to see both numbers for your own account rather than trust a single headline figure? Connect your content to the AI agent and run your first month against a repeat-contact audit through analytics. A one-dollar activation on pricing includes 100 test credits to check the gap yourself before you trust either number.
Frequently asked questions
What is the difference between deflection rate and resolution rate?
Deflection rate divides conversations a human never touched by total conversations. Resolution rate divides problems verified as solved by total problems reported, using a repeat-contact or confirmation check. The core difference is that deflection measures whether a human stepped in, and resolution measures whether the issue actually went away, a distinction the support ticket deflection rate guide covers from the deflection side alone.
Why do vendors quote deflection rate more than resolution rate?
Deflection rate is cheap and immediate. It only needs a log of whether a human replied, so it can be reported the same day a conversation closes. Resolution rate needs a verification step, usually a repeat-contact window of several days, which makes it slower to compute and less convenient for a real-time pitch number.
Is an 80% deflection rate realistic for a typical account?
Not as a median. Lorikeet's 2026 research put the Zendesk enterprise median at 41.2%, with marketed claims like Decagon's 80% coming from best-case accounts, narrow ticket categories, or generous definitions of what counts as deflected ($Lorikeet). An 80% figure is possible for a specific narrow use case, not a guarantee for a full, mixed ticket book.
How is resolution rate actually verified?
Most teams use a repeat-contact check: a problem only counts as resolved if the same customer does not reopen the same issue within a fixed window, commonly three to seven days. Some teams add an explicit confirmation step, such as a follow-up satisfaction question, but the repeat-contact method is the more common and cheaper default.
What repeat-contact window should I use for resolution rate?
Seven days is a common, defensible default, and the specific window matters less than keeping it fixed across every month you compare. Changing the window retroactively to flatter a number is the same mistake as switching formulas mid-comparison, and it destroys the trend line you were trying to build.
Can deflection rate go up while resolution rate goes down?
Yes, and it is one of the more useful diagnostic signals in this pair of metrics. It usually means the AI is closing more conversations without a human, but a growing share of those closures are not staying solved, often because the agent is answering confidently on categories it should be escalating, a failure mode covered in AI agent guardrails.
Should I report deflection rate or resolution rate to leadership?
Report both, labeled clearly, rather than picking one. Deflection rate answers a workload and staffing question, and resolution rate answers a quality and trust question. A single number presented as if it answers both questions will eventually be caught out when the other one is asked for.
Does a higher deflection rate always mean lower cost?
Usually, but not automatically. A conversation the AI closes without a human is cheaper in the moment, a relationship the cost per ticket benchmark guide breaks down in detail. If a large share of those deflected conversations come back as repeat contacts, the true cost includes a second, sometimes more expensive human resolution, which deflection rate alone will never show you.
What counts as a conversation in the deflection rate denominator?
Typically every distinct conversation thread the AI engaged with, regardless of how many messages it contains. This is looser than the resolution rate denominator, which counts distinct reported problems, so a single customer sending three separate follow-up messages in one thread usually counts once for deflection but could count as one or more problems for resolution depending on whether the topic changed.
Why does resolution rate lag deflection rate in reporting?
Because resolution rate needs the repeat-contact window to close before a conversation can be marked verified. A conversation from the last day of the month cannot be scored as resolved until its full window has passed, so a resolution number for the current month is always provisional until enough time has gone by.
How do I know if a published benchmark used deflection or resolution?
Check whether the source describes a verification step, such as a repeat-contact window or a confirmation survey. A number with no mention of verification and a same-day availability is almost always deflection rate, even when a headline calls it a resolution rate. Reading the methodology section of a benchmark like Lorikeet's is the fastest way to tell.
Does resolution rate account for human-resolved tickets too?
Yes. Resolution rate counts every verified solved problem in the denominator's population, regardless of whether a human or an AI agent did the solving. Deflection rate, by contrast, only exists for the subset of conversations the AI engaged with, since it is measuring whether a human was needed at all.
What is a healthy gap between deflection rate and resolution rate?
There is no universal healthy gap, since ticket mix and industry both shift the baseline, but a gap that stays roughly stable month over month is a better sign than one that widens. A widening gap usually means new deflected volume is not staying solved, which is worth investigating before it shows up as a satisfaction problem.
Can I improve resolution rate without changing deflection rate?
Yes, and it is often the more valuable improvement. Tightening the content the AI is grounded in, narrowing where it is allowed to answer confidently, and improving the human handoff for uncertain cases can raise resolution rate on the same deflected volume, a process covered in reducing AI hallucinations in support and training AI on your help center.
Why did HappySupport report a range instead of a single deflection number?
Because deflection genuinely varies by program maturity, and a single number would hide that. HappySupport's benchmark reports 45% to 60% in year one and 65% to 75% at maturity ($HappySupport), which is a more honest representation than collapsing an entire adoption curve into one figure.
Is deflection rate the same as self-service rate?
No, though they are often confused. Self-service rate measures customers who found an answer in documentation or a help center without opening a conversation at all. Deflection rate only measures conversations that were opened with an AI agent and closed without a human, so a customer who never contacted support in the first place does not appear in either the numerator or the denominator of deflection rate.
How does ticket complexity affect these two metrics?
Simple, well-documented questions tend to push both metrics up together, since they are easy for an AI to answer correctly and easy to verify as solved. Complex or ambiguous tickets tend to widen the gap between the two, because the AI can still close the conversation quickly while the underlying problem stays open, which is exactly the pattern the worked example in this guide illustrates.
Should a small support team even bother tracking resolution rate?
Yes, and arguably it matters more at small scale, where a single mismeasured month can distort a hiring or tooling decision. A small team can run the repeat-contact check manually on a sample of conversations if a full automated audit is not yet in place, which is a cheaper starting point than skipping verification entirely, and it pairs well with a lightweight shared inbox setup rather than a full analytics buildout.
What tools calculate resolution rate automatically?
Any platform that logs conversation timestamps and customer identity can build a repeat-contact check, since the calculation only needs to detect whether the same customer reopened the same topic inside a fixed window. Communicate's analytics runs this check alongside deflection tracking so the two numbers sit on one dashboard instead of requiring a separate export and manual audit.
Can marketing claims about deflection rate be trusted at all?
They can be trusted as a description of what happened in the specific account or ticket category the claim came from, as long as the source discloses that scope. The mistake is not the number itself, it is applying a best-case, narrow-category figure to a full, mixed ticket book without adjusting expectations for the difference.