
Cost per ticket benchmark: building the denominator correctly
 Communicate.so
Cost per ticket benchmarks by industry and channel, the full loaded-cost formula, and exactly what AI removes and adds to the number.
TL;DR: Cost per ticket is a simple division that most teams calculate with an incomplete numerator. The honest number includes loaded agent salary, support tooling, QA time, and management overhead, not just wages, and agent labor alone typically accounts for 70% to 80% of the total. Published benchmarks range widely by industry and channel: retail and ecommerce run roughly $2.70 to $5.60 per ticket, SaaS support $18 to $35, and B2B enterprise $30 to $60, while a self-service resolution can cost $1 to $4 and an AI-handled resolution as little as $0.50 to $2.37. This guide builds the denominator properly, shows what an AI agent actually removes from the cost stack and what it adds, and explains why a 2.3x hidden repeat-contact multiplier makes most teams' real cost per issue higher than their reported cost per ticket.
Ask five support leaders for their cost per ticket and you will get five different numbers, and the differences will usually trace back to what got counted, not what actually happened in the queue. A number built from wages alone and a number built from full loaded cost can differ by 30% or more on identical operations.
This guide builds the cost per ticket denominator the way a finance team would defend it, sets real industry and channel benchmarks, and separates what an AI agent genuinely removes from the cost stack from what it quietly adds. It closes with the repeat-contact multiplier that makes most reported numbers understate the real cost of an unresolved issue.
The goal is a number you can defend in a budget review, not a favorable one. A cost per ticket figure that only survives because it excludes tooling, QA, and management time will collapse the moment finance asks where the rest of the support budget actually goes, a question the pricing page for any support tool should be evaluated against directly.
What cost per ticket actually measures
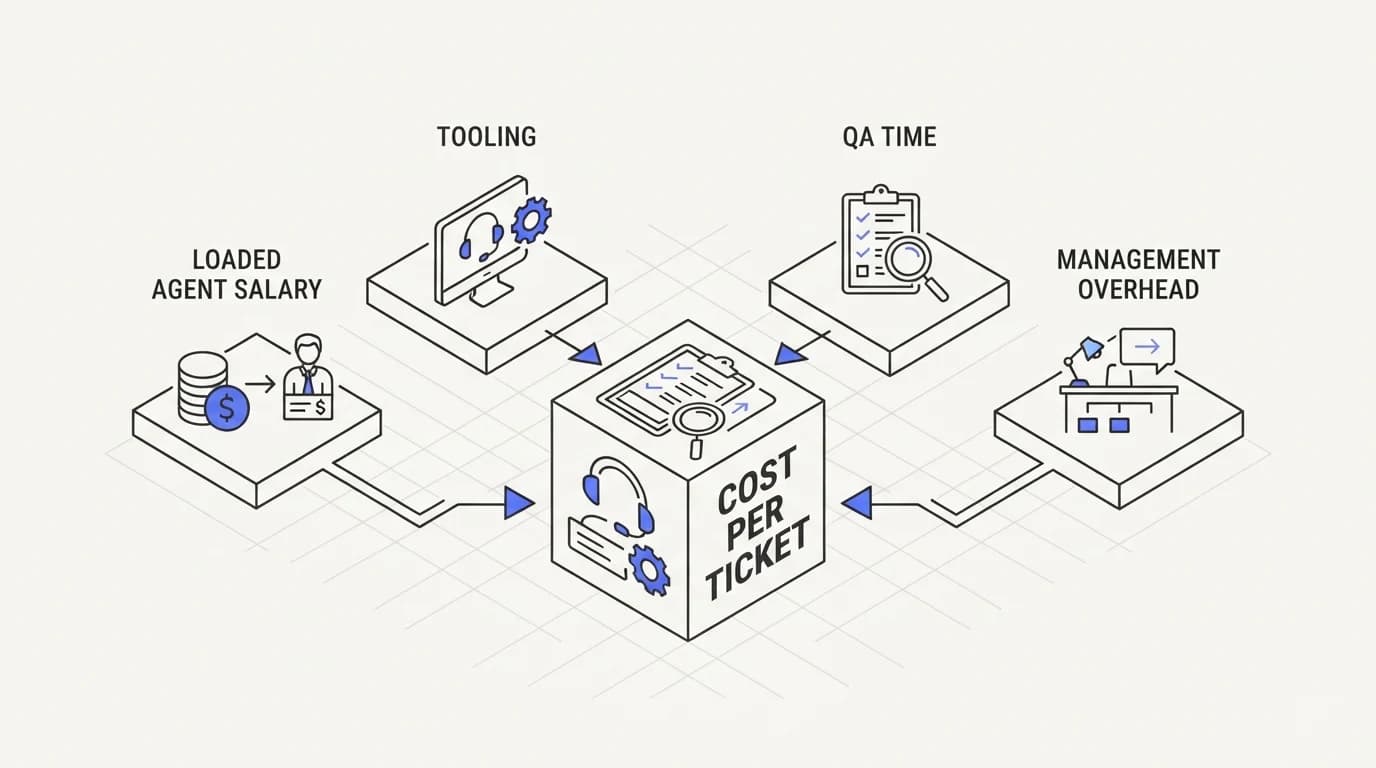
Cost per ticket is total support cost for a period divided by total tickets handled in that period. The formula is simple; building the numerator honestly is where most teams cut corners, usually by counting only agent wages and leaving out everything else that keeps a support operation running.
A defensible numerator includes loaded agent salary, which is base pay plus benefits and payroll taxes, plus the cost of every tool an agent touches, from the shared inbox or helpdesk platform to any knowledge base software. It also includes QA time, whether that is a dedicated quality team or a manager's hours spent reviewing conversations, and a fair share of management and training overhead.
Agent labor typically represents 70% to 80% of total cost per ticket, with tooling and overhead making up the remainder, according to cost breakdowns aggregated by support benchmarking research. That ratio is a useful sanity check: if your own calculation shows labor at 95% or more of total cost, you are probably missing tooling, QA, or management time in the numerator.
The period you choose for the calculation matters too. A monthly cost per ticket can swing on a single unusually heavy or light month, while an annual figure smooths seasonal spikes but hides the month a support operation actually struggled. Most finance teams want both: an annual number for budgeting and a monthly number for operational tracking.
Building the denominator: what counts as a ticket
 Communicate.so
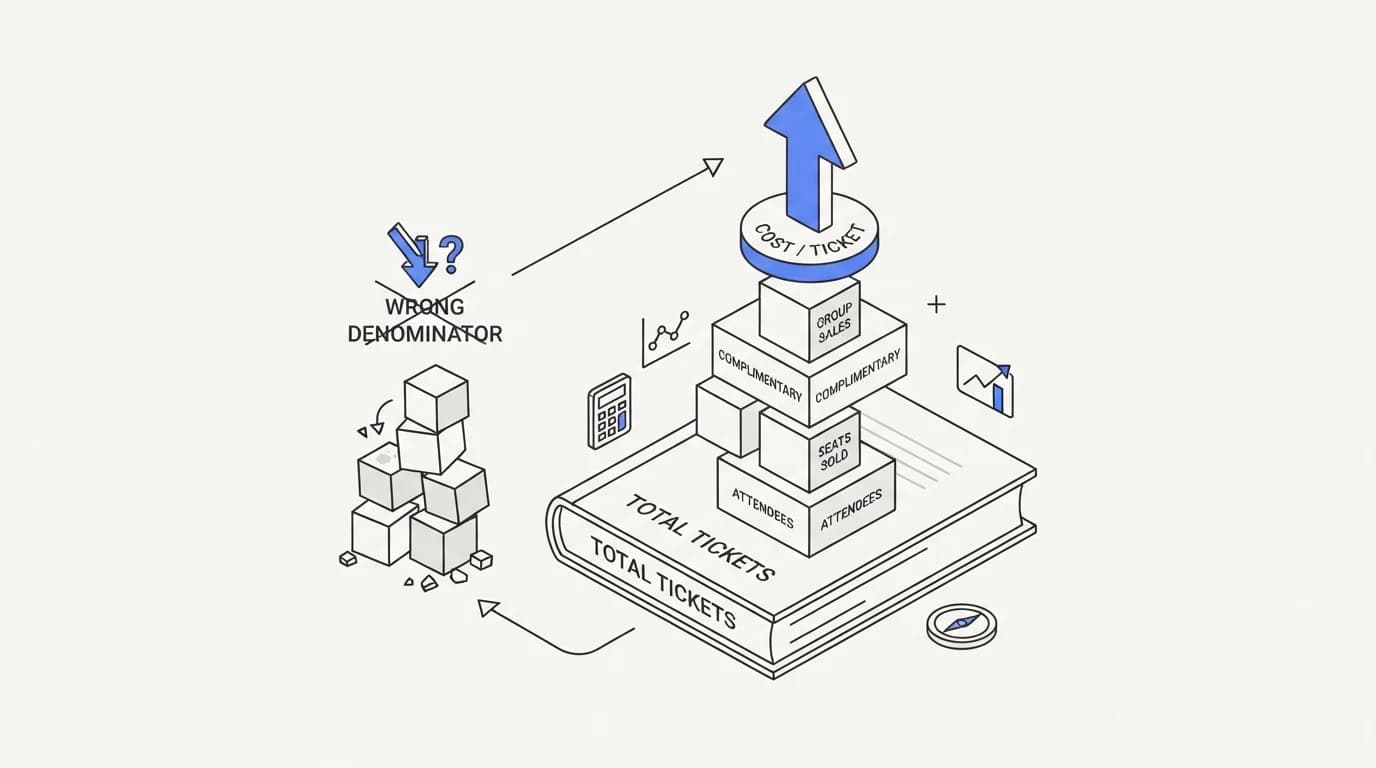
The denominator hides a second common error, which is treating every contact as a distinct ticket regardless of whether it represents a new issue. A customer who emails three times about the same unresolved refund generates three tickets in a naive count but represents one underlying issue, and dividing total cost by the inflated ticket count understates the true cost per issue.
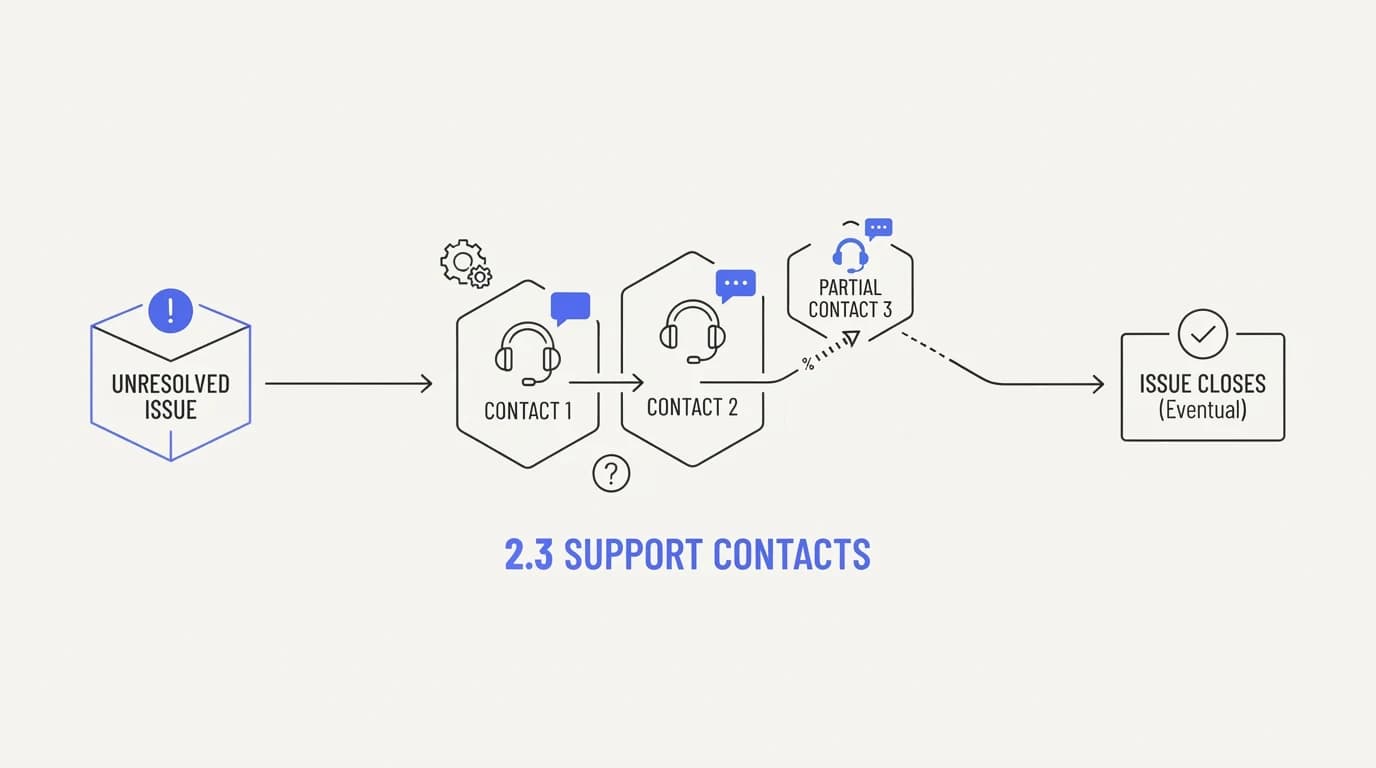
The average contact-per-issue ratio across support operations runs around 2.3, meaning a typical reported issue generates roughly 2.3 separate contacts before it is actually closed. A team that reports cost per ticket using raw contact counts, rather than deduplicated issues, is dividing by a denominator that is more than double the count of problems actually being solved.
This connects directly to the distinction covered in resolution rate versus deflection rate. A ticket count built on deflection-style logic, where every AI-only conversation counts as one closed ticket, will systematically undercount the true cost per issue whenever a deflected conversation later reopens as a fresh, uncounted contact.
Deduplicating issues requires a consistent identity for the customer and the topic across contacts, which is harder in practice than it sounds when a customer switches from chat to email midway through a single unresolved issue. A support platform that cannot link those two contacts together will always undercount contact-per-issue, and every cost figure downstream inherits that undercount.
Industry and channel benchmarks
| Segment | Typical cost per ticket | Primary cost driver |
|---|---|---|
| Retail and ecommerce | $2.70 to $5.60 | High volume, low complexity, self-service friendly |
| SaaS support | $18 to $35 | Technical depth, longer average handle time |
| High-tech support | $28 to $35 | Specialist agent skill requirements |
| B2B enterprise support | $30 to $60 | Multi-stakeholder tickets, contractual SLAs |
| Telecom and utilities | $20 to $30 | Regulatory and account complexity |
| Global cross-industry baseline | $6 to $7 | Blended across simple and complex ticket types |
Channel adds a second dimension on top of industry. Email or ticket-based support runs roughly $6 to $11 per case, voice support $9 to $16, and live chat or messaging $5 to $9, a spread driven mostly by agent handling capacity, since a chat agent can often run three to five concurrent conversations while a phone agent handles exactly one, a factor that also shapes first response time targets by channel.
Self-service sits well below every assisted channel, at roughly $1 to $4 per resolved issue, because the marginal cost of an existing help article being read again is close to zero. That gap is the entire economic argument for pushing repetitive, well-documented questions toward self-service or an AI agent before they ever reach a paid human channel.
Industry and channel benchmarks compound rather than replace each other. A SaaS company running most of its volume through email inherits both the higher SaaS baseline and the higher email channel cost, which explains why some SaaS support operations report figures at the top of the $18 to $35 range while others in the same industry land near the bottom simply because they route more volume through chat.
What an AI agent removes from the cost stack
 Communicate.so
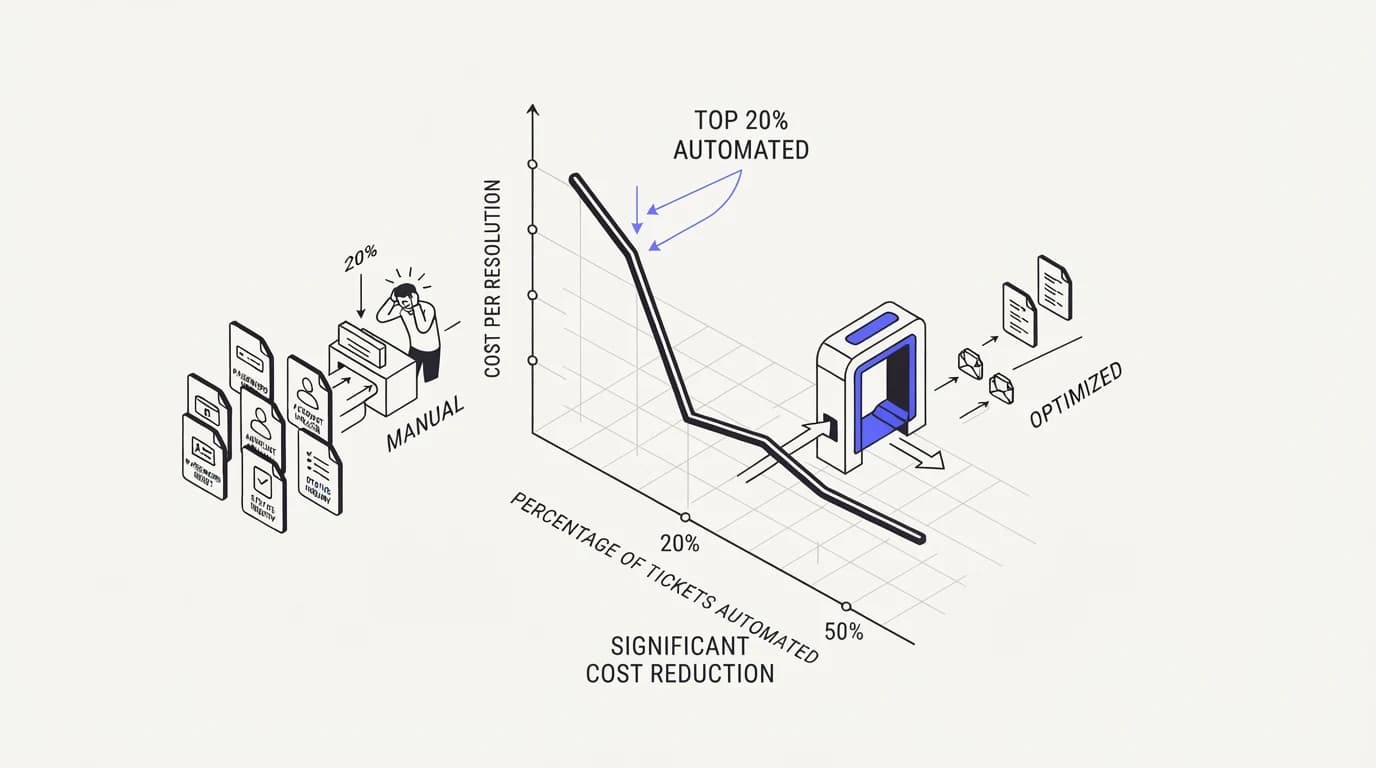
The clearest cost story in support right now is automation of the repetitive top slice of ticket volume. AI-handled resolutions run roughly $0.50 to $2.37 per resolution when the AI takes full ownership of the conversation, against $18 to $35 for the SaaS human baseline, an 85% to 95% reduction for that specific segment of volume, according to cost modeling published by Lorikeet.
That reduction is real, but it only applies to the segment of tickets the AI actually resolves correctly and permanently. Automating the top 20% of ticket types by volume, the well-documented, repetitive questions, is where the bulk of this savings lives, because that slice is also the one an AI agent can answer accurately from grounded content without much ambiguity.
The mechanism behind the savings is not a smaller headcount alone. It is fewer agent-minutes per resolved issue, since an AI agent answers instantly and in parallel across unlimited simultaneous conversations, compared to a human agent who can only carry a handful of chats at once, a capacity difference covered in more detail in average handle time reduction.
This parallelism is also why AI-driven cost savings scale differently from human staffing savings. Adding a tenth simultaneous conversation to an AI agent costs close to nothing incremental, while adding a tenth simultaneous conversation to a human agent means hiring another person, which is why volume spikes hit human-only operations far harder on cost per ticket than they hit an AI-assisted one.
What an AI agent adds back to the cost stack
The honest accounting includes what AI adds, not just what it removes. There is a direct line item for the AI platform itself, priced either per resolution or per seat depending on the vendor, and that cost needs to sit in the numerator the same way agent wages do.
There is also a less visible cost: guardrail design, content grounding, and ongoing QA of AI answers. An AI agent needs a curated knowledge base, a defined scope of what it should and should not answer, and a review process to catch drift, and all of that is real work, usually done by someone who used to be a full-time agent and is now spending part of their time maintaining the system instead.
The repeat-contact cost is the most expensive hidden addition. If an AI-deflected conversation reopens because the underlying problem was not actually solved, that issue now generates two costs: the near-zero AI cost of the first pass, plus the full human cost of the second pass, often higher than if a human had handled it correctly the first time, because the customer arrives already frustrated. This is exactly the failure mode reducing AI hallucinations in support is built to prevent before it reaches the cost ledger at all.
A second addition worth naming is escalation cost. When an AI agent hands off a conversation to a human, the human agent needs to read the existing context before replying, and that reading time is a real cost even when it is shorter than starting from a blank conversation. A clean handoff that preserves full context keeps this cost small; a handoff that loses context forces the human to reconstruct the conversation, which erases much of the time saved by the AI's first pass.
The 2.3x multiplier: why cost per issue beats cost per ticket
 Communicate.so
The 2.3 contact-per-issue average is the single most important adjustment to apply to any cost per ticket figure before trusting it. Real cost per issue is roughly 2.3 times the reported cost-per-contact figure once repeat contacts are counted against the original problem rather than treated as fresh, independent tickets ($Lorikeet).
This multiplier is also where AI deflection can quietly make a cost report look better than the underlying operation actually is. If deflected conversations that later reopen get counted as new, separate tickets rather than linked back to the original issue, the reported cost per ticket looks stable or improving even while the true cost per issue is rising, because the denominator keeps growing to absorb the repeat contacts.
The fix is structural, not a reporting trick: link repeat contacts back to their originating issue before calculating cost per ticket, the same way resolution rate requires a repeat-contact check before a conversation counts as genuinely closed. A cost figure and a quality figure that use the same linking logic will tell a consistent story instead of two different ones.
Applying the multiplier retroactively to a full year of reported cost per ticket is a useful exercise even for a team not yet ready to rebuild its reporting pipeline. Multiplying last year's reported figure by 2.3, then comparing it against the fully loaded cost of the human agents who handled the repeat contacts, often reveals that a support operation believed to be improving on cost was actually flat or worse once repeat volume is properly attributed.
Building your own honest cost per ticket
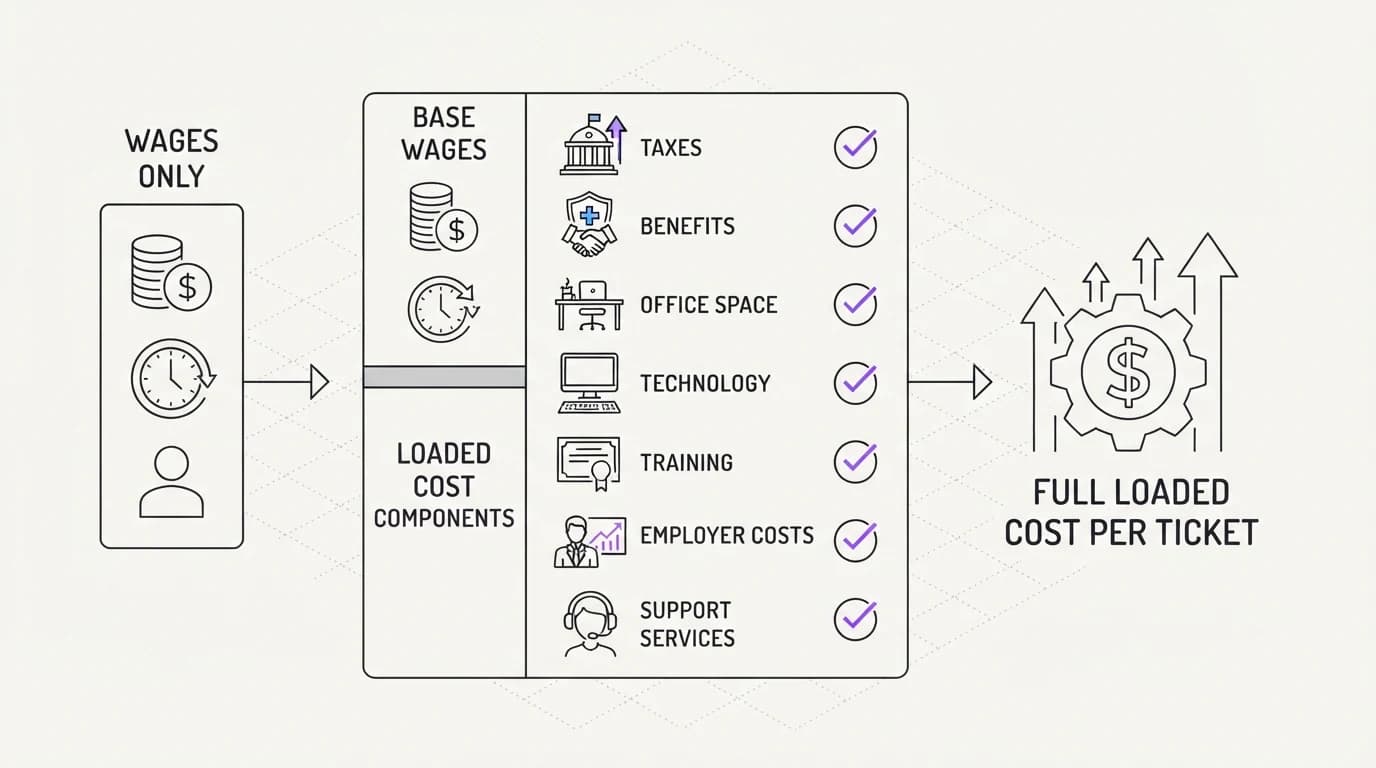 Communicate.so
| Cost component | Included in a full loaded number | Included in a wages-only number |
|---|---|---|
| Base agent salary | ✓ | ✓ |
| Benefits and payroll taxes | ✓ | ✗ |
| Support platform and tooling | ✓ | ✗ |
| QA and quality review time | ✓ | ✗ |
| Management and training overhead | ✓ | ✗ |
| AI platform or resolution cost | ✓ | ✗ |
| Repeat contacts linked to original issue | ✓ | ✗ |
A wages-only number will always look better than a full loaded number, which is exactly why it should not be the figure used to compare against a vendor's cost claim or an industry benchmark. Build the full version once, even if it takes longer, and reuse the same methodology every quarter so the trend line stays honest.
Once the full number exists, break it down by ticket type, not just as one blended figure. A single blended cost per ticket hides the fact that a password reset and a billing dispute cost wildly different amounts to resolve, and that gap is exactly where automation decisions should be targeted first.
Where Communicate fits, honestly
Communicate prices on a credit-based usage model rather than per seat, which keeps the cost line item tracking actual resolution volume instead of headcount, a structural choice detailed on pricing. That model makes the AI's share of your cost per ticket directly visible rather than buried in a flat monthly platform fee.
The AI agent is grounded in your connected content rather than answering from general model knowledge, which is the design choice most directly aimed at keeping the repeat-contact multiplier low. A wrong but confident answer is the single most expensive failure mode in this entire cost model, since it adds a near-zero-cost AI pass and then a full-cost human pass to resolve the same issue.
The honest limit is that no platform can promise a fixed cost per ticket number, since your own labor rates, ticket mix, and content coverage all shape the real figure more than the tool does. What Communicate can do is keep the AI's own cost line item transparent and usage-based, so you can plug it into the full loaded formula this guide walks through rather than trusting a vendor's blended marketing number. A one-dollar activation on pricing includes 100 test credits to model your own numbers before committing.
Key takeaways
- A defensible cost per ticket includes loaded salary, tooling, QA time, and management overhead, not wages alone, and agent labor typically runs 70% to 80% of that full total.
- Published benchmarks run from roughly $2.70 in retail to $60 in B2B enterprise support, so compare your own number against your specific industry, not one blended figure.
- AI-handled resolutions run $0.50 to $2.37 against an $18 to $35 SaaS human baseline, an 85% to 95% reduction, but only for the repetitive slice of volume the AI resolves correctly.
- A real 2.3x contact-per-issue multiplier means reported cost per ticket understates true cost per issue whenever repeat contacts are not linked back to their original problem.
- Build the full loaded number once, reuse the same methodology every quarter, and break it down by ticket type rather than reporting a single blended average.
Want to see your own AI cost per resolution against your current loaded human cost? Connect your content to the AI agent and check usage against pricing. The one-dollar activation includes 100 test credits to model the real number before you commit a budget line to it.
Frequently asked questions
What is included in a proper cost per ticket calculation?
Loaded agent salary, benefits, and payroll taxes, support platform and tooling costs, QA and quality review time, management and training overhead, and any AI platform or per-resolution fees. A calculation that only includes base wages will understate the true cost, often significantly, since agent labor typically represents only 70% to 80% of the full loaded total.
What is a typical cost per ticket in SaaS support?
Roughly $18 to $35 per ticket, higher than retail or education because SaaS tickets tend to involve more technical depth and longer average handle time. Cost modeling from Lorikeet places this range against a $2.70 to $5.60 retail baseline for comparison.
How much does an AI-resolved ticket cost compared to a human one?
AI-handled resolutions run roughly $0.50 to $2.37 per resolution when the AI fully owns the conversation, against $18 to $35 for a typical SaaS human resolution, an 85% to 95% reduction for that segment of volume ($Lorikeet). That gap only applies to tickets the AI actually resolves correctly and permanently, not to the full ticket book.
What is the 2.3x contact-per-issue multiplier?
It is the average number of separate contacts a single underlying issue generates before it is actually closed, based on cost benchmarking research across support operations. A cost-per-ticket figure calculated on raw contact counts, without linking repeat contacts back to their original issue, understates true cost per issue by roughly this same multiple.
Why does agent labor represent only 70 to 80 percent of cost per ticket?
Because a full loaded number also includes tooling, QA time, and management overhead, which together make up the remaining 20% to 30%. If your own number shows labor at 95% or more of total cost, you are likely missing one or more of these categories from the calculation.
Does self-service really cost less than $4 per resolution?
Yes, roughly $1 to $4 per resolved issue, since the marginal cost of an existing help article being read again by a new customer is close to zero. The upfront cost of writing and maintaining that content is real but amortizes across every customer who finds the answer without contacting support at all.
How does channel affect cost per ticket?
Significantly. Email or ticket-based support runs roughly $6 to $11 per case, voice $9 to $16, and live chat or messaging $5 to $9. The gap is driven largely by agent handling capacity, since a chat agent can often run several concurrent conversations while a phone agent handles exactly one at a time.
What does B2B enterprise support cost per ticket, and why is it higher?
Roughly $30 to $60 per ticket, the highest of the common industry segments, driven by multi-stakeholder tickets, contractual SLA obligations, and specialist agent skill requirements. A single enterprise ticket often involves more internal coordination than several retail tickets combined, which shows up directly in the cost.
Can AI adoption increase cost per ticket instead of lowering it?
Yes, if the repeat-contact rate rises faster than the direct cost savings. An AI agent that deflects cheaply but incorrectly adds a near-zero-cost first pass and then a full-cost human second pass to the same issue, which can push true cost per issue above the pre-AI baseline even while cost per ticket looks improved, a risk covered directly in AI agent guardrails.
Should management and training time be included in cost per ticket?
Yes. A support operation with no management or training overhead does not exist in practice, and excluding that time from the numerator produces a number that flatters the operation without reflecting its real cost. Even an estimate based on a manager's approximate time allocation is more honest than omitting the category entirely.
How do I calculate cost per issue instead of cost per ticket?
Link every contact back to its originating issue using a repeat-contact window, similar to how resolution rate verification works, then divide total loaded cost by the count of distinct issues rather than distinct contacts. This produces a smaller denominator and a higher, more honest cost figure than raw ticket counts.
What ticket types should be automated first for cost savings?
The top 20% of ticket types by volume that are also well-documented and low-ambiguity, since that segment captures most of the achievable savings while carrying the lowest risk of an incorrect answer. Training the AI on your help center content directly targets this segment first.
Does a lower cost per ticket always mean a healthier support operation?
No. A falling cost per ticket that comes from an inflated denominator, deflected conversations that later reopen as fresh uncounted tickets, or excluded overhead can look healthy while the underlying operation is not. Reading cost per ticket alongside resolution rate and CSAT together catches this kind of false improvement.
How much does QA time typically add to cost per ticket?
There is no single universal figure, since QA staffing intensity varies by operation, but it is a meaningful enough share that excluding it distorts the total. A support team running formal quality review, even at a small sampling rate, should estimate the reviewer hours involved and add a proportional cost per ticket to the numerator.
Is cost per ticket the right metric for comparing vendors?
Only if both sides are using the same loaded-cost methodology, which is rarely disclosed clearly in vendor marketing. A vendor quoting a per-resolution AI cost against your fully loaded human cost is making an apples-to-oranges comparison unless your own number also excludes tooling and overhead, which is why building your own honest cost per ticket benchmark matters before evaluating any vendor claim.
What is the global average cost per ticket across industries?
Roughly $6 to $7 per contact as a blended cross-industry baseline, though this figure is much less useful than an industry-specific number, since it averages across segments running from $2.70 to $60. Use it only as a rough sanity check, and compare your own operation against the closer benchmark in the cost per ticket benchmark table for your industry instead.
Once cost per ticket is calculated honestly, multiplying it by projected ticket volume for the next period gives a defensible support budget line, one finance can trust because the inputs are documented rather than estimated from a partial number that happened to look favorable in a prior review.
How does average handle time relate to cost per ticket?
Average handle time is the largest driver of the labor portion of cost per ticket, since a longer conversation consumes more paid agent time regardless of channel. Reducing average handle time on well-defined ticket types, without sacrificing resolution quality, is one of the more direct levers available for lowering the labor share of the total.
Should cost per ticket be tracked monthly or quarterly?
Monthly tracking catches trends faster, but a single month can be noisy if repeat-contact linking has not fully caught up for tickets near the end of the period, since the most recent weeks have not had time to generate their repeat contacts yet. A monthly view paired with a rolling three-month average gives both the early signal and the more stable trend line.
Does outsourcing change how cost per ticket should be calculated?
The formula stays the same, but the loaded-cost inputs shift, since an outsourced contract typically bundles wages, tooling, and management into a single per-ticket or per-hour rate. The comparison to an in-house loaded number is still valid as long as both sides include the same categories, which is worth confirming explicitly in the outsourcing contract's cost breakdown.
Outsourced contracts also sometimes exclude QA and escalation handling from the quoted per-ticket rate, pushing those costs back onto the contracting company as a separate line item. Reading the contract closely for what falls outside the quoted rate matters as much as the rate itself when comparing an outsourced number against an in-house one.
What is the biggest reporting mistake teams make with cost per ticket?
Reporting a wages-only number as if it were the full cost, then comparing it against an industry benchmark that was built on a full loaded methodology. The two numbers are not measuring the same thing, and the mismatch usually makes an internal operation look artificially efficient against the external benchmark until someone builds the full number and finds the gap.
A close second mistake is treating a single quarter's improvement as proof the operation is fixed, without checking whether the repeat-contact rate moved in the opposite direction during the same period. A cost per ticket figure that improved because more issues went unresolved on the first pass is not an improvement at all once the second pass is counted.