
Customer support KPIs: the four that decide and the six that decorate
 Communicate.so
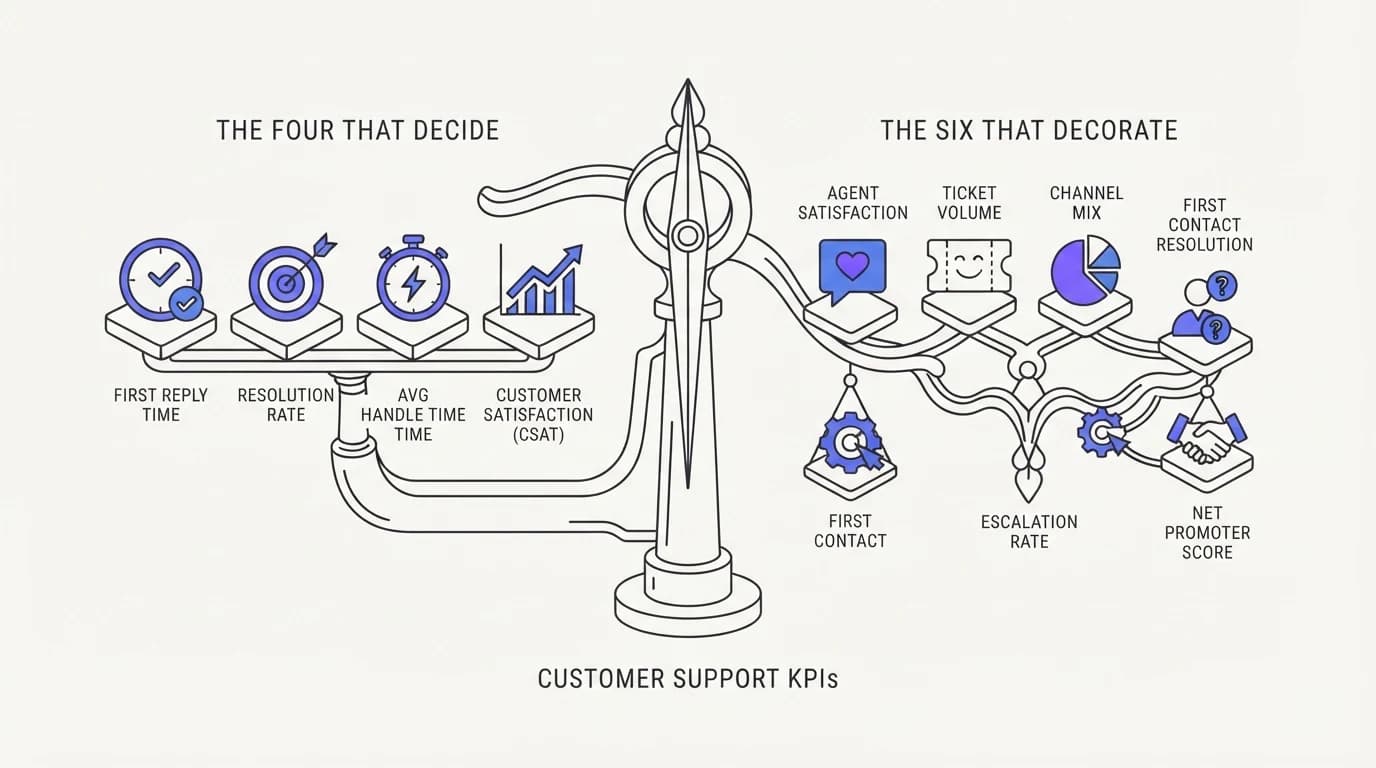
Customer support KPIs ranked by decision weight: four metrics that should change what you do next, and six that mostly decorate a dashboard.
TL;DR: Most support dashboards track fifteen numbers and none of them change what a manager does on Monday morning. This guide ranks customer support KPIs by decision weight rather than dashboard tradition, and names four metrics that should trigger a staffing change, a process fix, or an escalation review the moment they move: first response time, resolution time, escalation rate, and cost per ticket. Six more metrics, including CSAT, NPS, ticket volume, and agent utilization, still belong on a dashboard, but as context rather than triggers, because none of them tells you what to do next on its own. A team drowning in twenty tracked numbers is worse instrumented than a team with four numbers it actually acts on. Every figure below carries a named source, and the ranking explains how AI agents change what a couple of these metrics measure once they start answering a share of tickets before a human sees them.
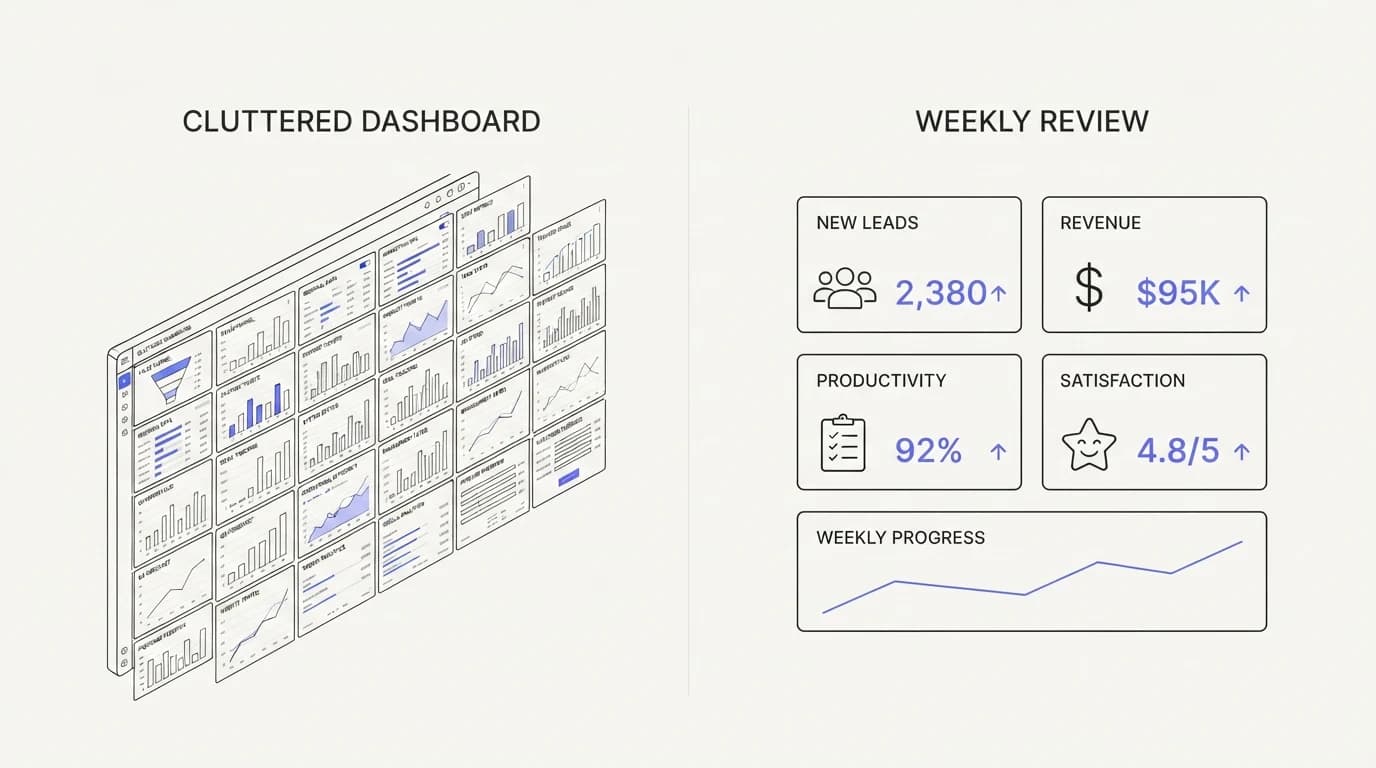
Open ten support dashboards and you will find roughly the same twenty rows: first response time, resolution time, CSAT, NPS, ticket volume, backlog size, agent utilization, cost per ticket, escalation rate, and a handful more that nobody quite agrees how to define. The problem is not that these numbers are wrong. The problem is that most of them do not tell anyone what to do next, and a manager tracking twenty numbers each week usually acts on somewhere between two and four of them.
This guide ranks customer support KPIs by one test: does moving this number, by itself, tell you to change something? Four metrics pass that test on a normal week. Six more are worth watching but rarely decide anything alone, and treating them as decision triggers is how a team ends up chasing a CSAT dip caused by a survey timing change instead of investigating a real quality problem.
The ranking below is a position, not a survey of every metric that exists. It draws on published benchmark research from Lorikeet, Twig, and DigitalApplied, and it argues that four decision-grade KPIs beat a wall of dashboard rows most weeks. Where a metric shifts because an AI agent now answers part of the queue, the article says so directly rather than pretending the old baseline still applies.
What makes a KPI decision-grade, not a vanity number
A decision-grade KPI answers a specific question: what should I do differently this week? First response time answers that question directly, because a number outside target tells you to add coverage, fix routing, or investigate a channel. A vanity metric like total ticket volume answers a different question, how busy were we, which is interesting but does not point at an action.
Three tests separate the two categories. A decision-grade KPI moves in response to a specific, fixable cause, gets worse before a real problem gets fixed, and points at one or two clear actions rather than five vague ones. Ticket volume fails all three, because volume rises for reasons ranging from a product launch to a billing bug to seasonal demand, and none of those causes point at the same fix.
The four KPIs that clear this bar are first response time, resolution time, escalation rate, and cost per ticket. Each one, moved on its own, tells a manager something specific to do. The six that follow are useful context around those four, but none of them decides anything by itself, and this guide treats that distinction as the whole point.
First response time: the fastest KPI to game, wrong to ignore
 Communicate.so
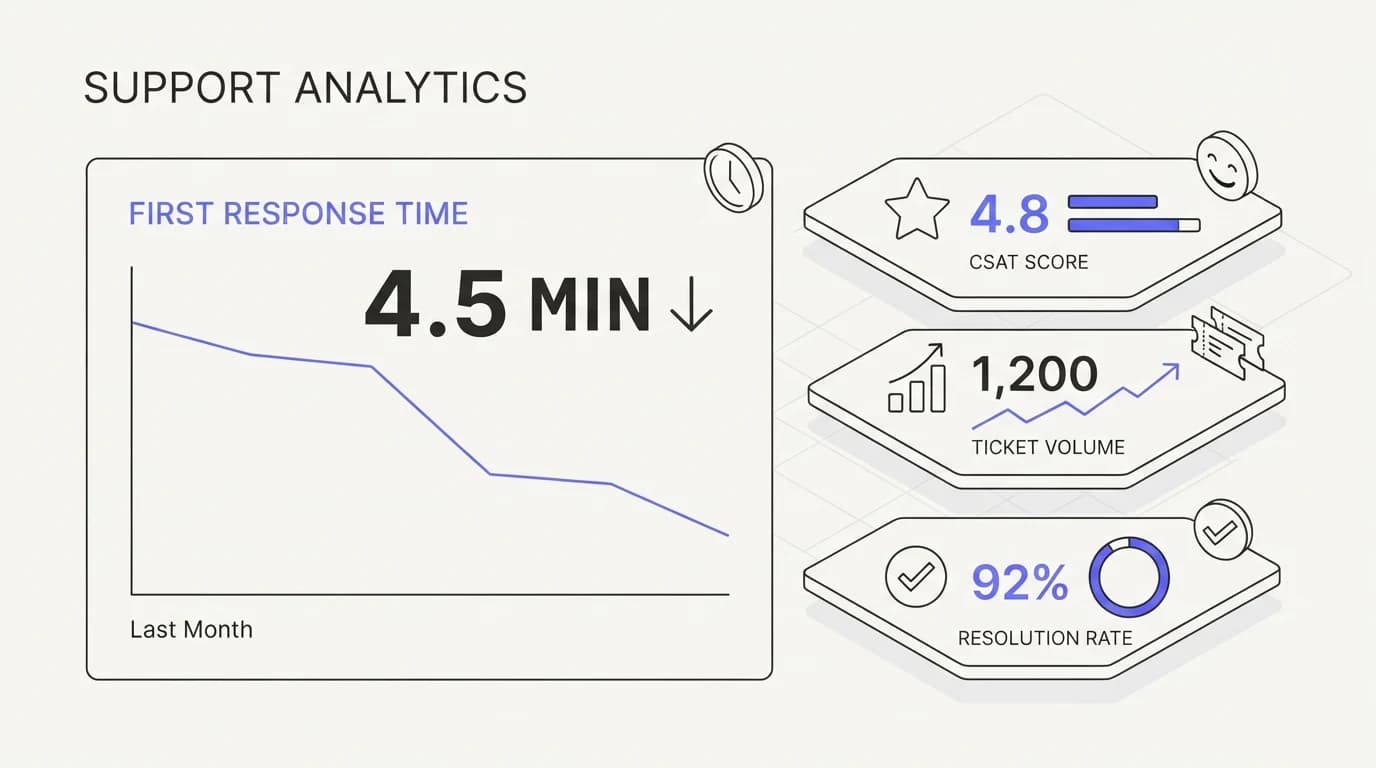
First response time is how long a customer waits for the first real reply, and it is the single number that predicts satisfaction better than any other. Lorikeet's 2026 benchmark analysis found first response time predicts CSAT roughly three times more reliably than resolution time, and puts top-performing live chat teams under 40 seconds, with email averaging 7 to 12 hours across the wider market even though customers expect a reply within roughly 4 hours (Lorikeet).
The metric is decision-grade because a slow first response has one clean fix: add coverage, fix routing, or automate the acknowledgment. It is also the easiest KPI to game, because an automated one-line acknowledgment counts as a response even though the customer's problem is untouched, so a serious dashboard should pair it with resolution time rather than reading it alone.
A queue that misses its target consistently is telling you something specific about staffing or routing, not about agent skill. Ringly's 2026 response time benchmark work found that 63% of customers rank speed of response as the top factor in a support experience, ahead of resolution speed and channel availability (Ringly), which is why this metric sits at the top of the decision-grade list rather than the middle.
Resolution time: the KPI that argues with first response time
Resolution time is how long a problem takes to actually close, and it is the KPI that keeps first response time honest. A team can hit every first response target by sending fast acknowledgments while the underlying problem drags on for days, and resolution time is what exposes that gap. First-call resolution in the 70 to 79% range is generally considered strong, according to Lorikeet's enterprise benchmark work, with the same research placing enterprise deflection at a 41.2% median against vendor claims closer to 80%, a gap this metric's sibling article on deflection versus resolution covers directly.
The decision this KPI triggers is different from first response time. A slipping resolution time points at knowledge gaps, unclear escalation paths, or agents lacking the authority to close a case, not at staffing headcount. Fixing it usually means better documentation, clearer ownership rules, or removing an approval step that adds delay without adding quality.
Read the two together and a queue tells you two separate stories. Fast first response with slow resolution means the team is responsive but under-equipped, and the fix lives in the average handle time work, not in headcount. Slow first response with fast resolution once a human engages means the bottleneck is queue entry, not agent skill, and that distinction changes which lever a manager pulls.
Escalation rate: the health check nobody screenshots for the board
Escalation rate is the share of conversations that move past the first line of support, and it is the honest measure of whether your front line can actually handle what arrives. A rising escalation rate is rarely a people problem. It usually means the documentation feeding the front line, human or AI, has fallen behind the product, or that a new issue category has appeared that nobody has written an answer for yet.
This is a decision-grade metric because the fix is narrow and identifiable. A spike in escalations tied to one topic points straight at a documentation gap, and a spike spread evenly across topics points at a training or tooling problem instead. Either read tells a manager exactly where to look next, which is what separates this metric from a broad quality score that says something is wrong without saying what.
Escalation rate also matters more once an AI agent handles part of the queue, because a rising escalation rate from the AI layer specifically flags where its guardrails are correctly refusing to guess rather than answering wrong. A well-tuned agent should escalate more, not less, on genuinely ambiguous cases, and reading that number as a failure is a common and costly misread.
Cost per ticket: the KPI that turns support into a line item
 Communicate.so
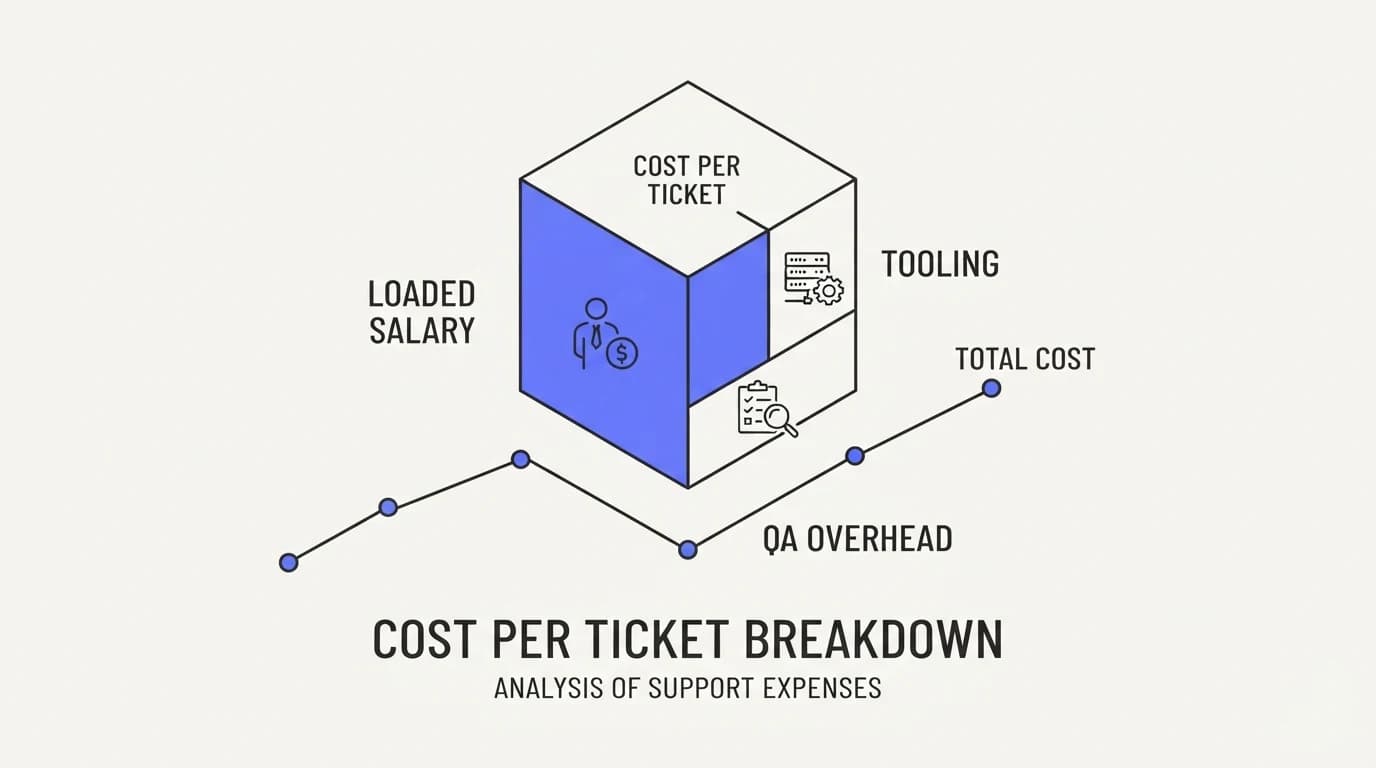
Cost per ticket is the fully loaded cost of resolving one conversation, including salary, tooling, and management overhead, divided by ticket volume. It is decision-grade because it converts every other metric into a number a finance team will actually read, and because it is the one metric that directly justifies or kills a headcount request.
The number only works if the denominator is honest. A cost figure that ignores tooling and management time flatters the current setup and hides the real return on an investment like an AI agent that removes repetitive volume before it reaches a human. The companion piece on AI customer support cost walks through building that denominator properly.
A team that tracks cost per ticket alongside resolution time and escalation rate can answer the question every finance conversation eventually asks: are we spending more to resolve the same problems, or resolving more problems for the same spend. Without this number, that question gets answered with a guess instead of a figure.
The six KPIs that decorate a dashboard and rarely move a decision
CSAT, NPS, ticket volume, average handle time read alone, agent utilization, and tickets per agent all deserve a place on a dashboard, and none of them should trigger a decision by itself. CSAT swings with survey timing and question wording as much as with actual quality, and a single-digit shift usually reflects noise rather than a trend worth acting on.
NPS answers a relationship question, not a support-quality question, and treating a dip in NPS as a support problem often points a fix at the wrong team. Ticket volume rises and falls with product launches, seasonality, and marketing pushes, none of which a support manager controls directly, so volume alone rarely tells anyone what to change inside the support function.
Average handle time read alone rewards the wrong behavior, because an agent can lower it by rushing a customer off the phone, which the average handle time guide addresses directly. Agent utilization and tickets per agent both measure busyness rather than outcomes, and a team can hit strong numbers on both while resolution quality quietly degrades.
None of this means these six numbers are worthless. They are context that explains why the four decision-grade metrics moved, and a manager should read them alongside the top four, never instead of them. The mistake is building a dashboard that gives all ten equal weight, because that flattens the four numbers that actually decide something into the same visual importance as six that mostly describe.
| KPI | Decision-grade | What it tells you to do |
|---|---|---|
| First response time | ✓ | Add coverage, fix routing, or automate acknowledgment |
| Resolution time | ✓ | Fix documentation, ownership, or approval friction |
| Escalation rate | ✓ | Find the topic or guardrail gap driving the spike |
| Cost per ticket | ✓ | Justify or reject a headcount or tooling change |
| CSAT | ✗ | Context only, moves with survey timing |
| NPS | ✗ | Relationship signal, not a support-quality trigger |
| Ticket volume | ✗ | Describes demand, not a support fix |
| Average handle time alone | ✗ | Rewards rushing without resolution context |
| Agent utilization | ✗ | Measures busyness, not outcomes |
| Tickets per agent | ✗ | Describes load, not quality |
How AI agents change what these KPIs measure
 Communicate.so
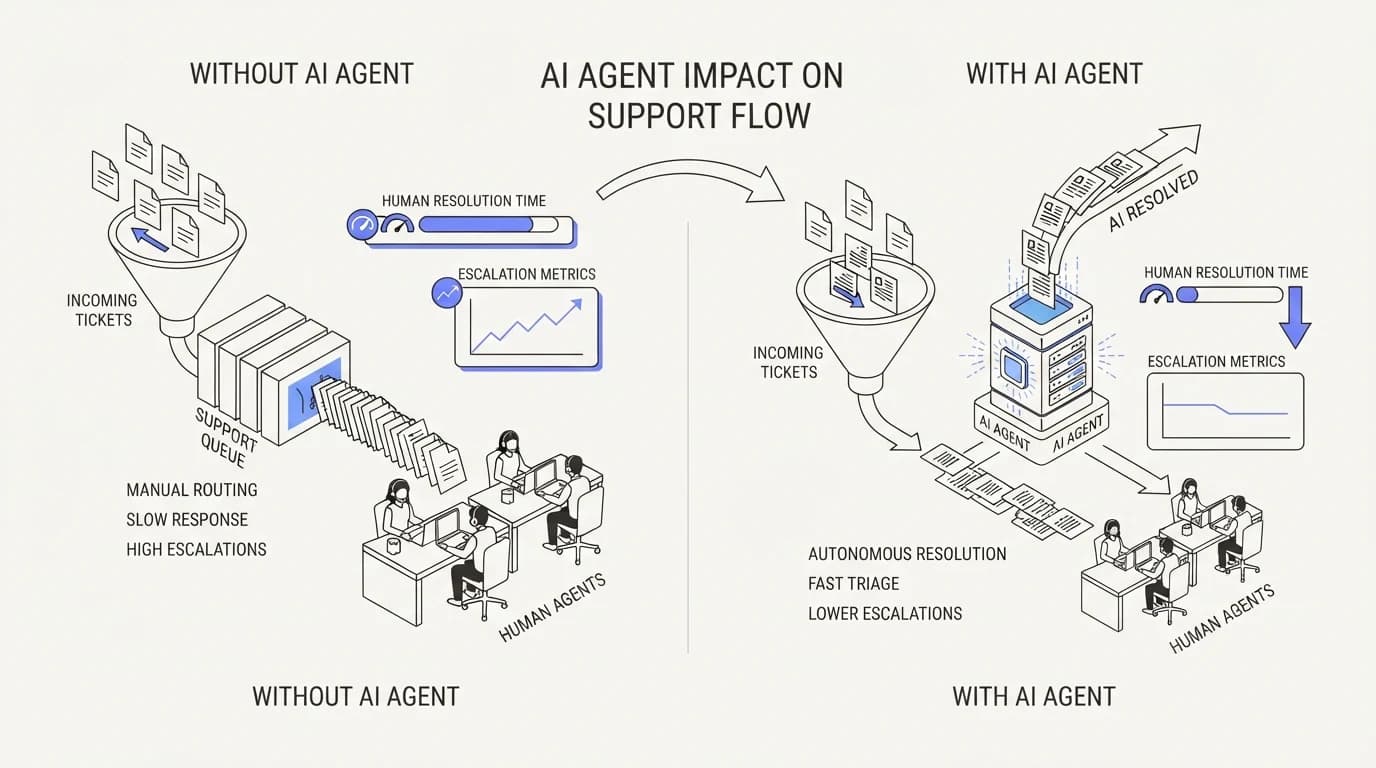
An AI agent that answers part of the queue before a human sees it changes the meaning of several KPIs on this list, and pretending the baseline holds produces a misleading trend line. Resolution time drops sharply once simple, repetitive questions never reach a human, and reading that drop as an agent-skill improvement misses the real cause.
Escalation rate becomes a more precise instrument once an AI agent is in the loop, because it now measures two things at once: how often the AI correctly refuses to guess, and how often a customer needed a human anyway. Splitting those two causes apart is worth the extra dashboard row, because conflating them hides whether the agent is under-confident or genuinely under-equipped.
Cost per ticket needs the same care. A queue where an AI agent resolves the documented majority will show a lower blended cost per ticket even if the humans remaining are handling harder, slower cases, and a manager reading that number without the mix breakdown could conclude the wrong thing about agent staffing. Salesforce's research puts the service organizations running AI agents at 66% in 2026, up from 39% in 2025 (DigitalApplied), which means this mix-shift problem is now the norm, not the exception, across support dashboards.
Building a KPI dashboard that forces a decision each week
A dashboard built around this ranking has four rows at the top that trigger a review the moment they cross a threshold, and a second section below with the six context metrics visible but visually smaller. First response time, resolution time, escalation rate, and cost per ticket get their own weekly review, and the six others get checked for context when one of the top four moves.
Set a real threshold for each of the four, not a vague target. A first response time miss of five minutes over target for one day is noise, but a miss that persists for a week is a routing or staffing problem worth a real conversation. Thresholds turn a KPI from a number you glance at into a number that actually triggers action.
Review the dashboard at a cadence that matches how fast the four numbers actually move, typically weekly for a team under real volume. Reading it daily invites overreaction to noise, and reading it monthly means a real problem sits unaddressed for weeks. The analytics view that pairs these four numbers against ticket mix is what turns a dashboard into a weekly operating rhythm instead of a report nobody opens.
Common mistakes when picking support KPIs
 Communicate.so
The most common mistake is copying a competitor's dashboard instead of building one around your own decisions. A team that mirrors a larger company's twenty-row dashboard inherits that company's reporting overhead without inheriting its staffing or budget, and ends up tracking numbers nobody has time to act on.
A second mistake is treating every KPI as equally serious, which this guide has argued against directly. A CSAT dip and a first response time miss are not the same category of problem, and giving them equal dashboard real estate trains a team to react to noise as often as to a real signal, a pattern the quality assurance process should catch before it reaches leadership.
A third mistake is measuring an AI agent against the same raw numbers as a fully human team without adjusting for mix. An agent should be judged on escalation accuracy and resolution quality within its scope, not compared directly against a human resolution time average that includes complex cases the agent was never meant to touch.
Where Communicate fits, honestly
Communicate is a grounded AI agent paired with a shared inbox, and it reports the four decision-grade KPIs above directly through its analytics view, split by AI-handled and human-handled volume so the mix-shift problem described earlier does not hide inside a blended number. It shows first response time, resolution time, escalation rate, and cost per ticket for each channel separately, not just a combined average.
The honest limit is that Communicate's analytics cover the metrics it can measure directly from its own conversations, not a full BI warehouse. If your KPI program needs cross-tool reporting joining CRM revenue data with support metrics, that is a heavier analytics stack than this tool provides. Pricing runs on a one-time $1 activation with 100 test credits and credit-based usage after that, detailed on the pricing page, and questions go to [email protected].
Frequently asked questions
What are the most important customer support KPIs?
First response time, resolution time, escalation rate, and cost per ticket are the four most decision-grade customer support KPIs, because each one, moved on its own, points at a specific action. CSAT, NPS, ticket volume, average handle time read alone, agent utilization, and tickets per agent remain useful context but rarely trigger a decision by themselves. The analytics a team builds should weight the first group heavier than the second.
Why is first response time more important than resolution time?
First response time is not more important, it is faster to diagnose and predicts satisfaction more reliably on its own, with Lorikeet's 2026 research putting that prediction strength at roughly three times resolution time's (Lorikeet). Resolution time still matters and should always be read alongside first response time, because a fast acknowledgment paired with a slow close is a common way teams game the faster metric without truly serving the customer.
What is a good first response time for customer support?
Top-performing live chat teams respond under 40 seconds, while strong email support typically replies within 4 hours even though the broader market average sits between 7 and 12 hours. The right target depends on channel and customer expectation, so a team should set its own threshold against its actual channel mix rather than copying a benchmark from a different industry wholesale.
What is a good resolution time benchmark?
A first-call resolution rate between 70% and 79% is generally considered strong across enterprise support benchmarks. Full resolution time varies far more by issue complexity than first response time does, so a single universal target is less useful here than tracking your own resolution time trend against your own ticket mix over several months.
How is cost per ticket calculated?
Cost per ticket divides total support cost, including loaded salary, tooling spend, quality assurance time, and management overhead, by total ticket volume for the same period. Leaving out tooling or management time is the most common way this number gets understated, and the AI customer support cost guide walks through building the denominator correctly.
Is CSAT a reliable customer support KPI?
CSAT is a useful context metric but an unreliable decision trigger on its own, because it swings with survey timing, question wording, and recency bias as much as with actual support quality. A single-digit CSAT change in one week is usually noise, and a manager should look for a sustained multi-week trend before treating a CSAT shift as a real quality signal.
Should support teams track NPS?
NPS is worth tracking as a relationship-health signal but it answers a different question than support quality does, and a dip in NPS is not automatically a support problem. Treating NPS as a support KPI often sends a fix at the wrong team, when the real driver might be pricing, product fit, or a competitor's move rather than anything a support queue controls.
Why does escalation rate matter more once AI agents are involved?
Escalation rate becomes a more precise instrument once an AI agent handles part of the queue, because it now measures both how often the agent correctly declines to guess and how often a customer genuinely needed a human. A well-tuned agent with strong guardrails should escalate ambiguous cases rather than answer them incorrectly, so a rising escalation rate from the AI layer is not automatically a failure.
What is a decision-grade KPI?
A decision-grade KPI is a metric that, moved on its own, tells a manager a specific action to take next. It passes three tests: it moves in response to a fixable cause, it worsens before an underlying problem gets fixed, and it points at one or two clear actions rather than five vague ones. Ticket volume and agent utilization fail this test, while first response time and cost per ticket pass it.
How many KPIs should a support team track?
A support team should track four decision-grade KPIs as weekly review triggers and a handful of context metrics that get checked when one of the top four moves. Tracking twenty metrics with equal weight usually means a team acts on two to four of them anyway, so the other sixteen add reporting overhead without adding decisions.
How often should support KPIs be reviewed?
A cadence matching how fast the metric actually moves works best, typically weekly for the four decision-grade KPIs under real ticket volume. Reviewing daily invites overreaction to normal daily noise, and reviewing monthly lets a real problem sit unaddressed for weeks, so the analytics view a team checks weekly should already flag threshold breaches rather than requiring a manual scan.
Does average handle time matter if I already track resolution time?
Average handle time still matters, but only when read alongside resolution outcomes, because handle time alone rewards agents who rush customers off a conversation without actually solving the problem. The average handle time reduction guide covers how to lower this number without sacrificing resolution quality.
What KPI should trigger a staffing decision?
First response time is the clearest staffing trigger, because a sustained miss against target almost always points at insufficient coverage or broken routing rather than an agent-skill problem. Resolution time and escalation rate should be checked before finalizing a staffing change, since a slow resolution time sometimes points at documentation gaps that more headcount will not fix.
How does an AI agent affect cost per ticket?
An AI agent that resolves the documented majority of a queue lowers blended cost per ticket, but the number needs a mix breakdown to stay honest, because the humans handling the remaining cases are working on harder, slower tickets than the old blended average implied. A dashboard that reports cost per ticket by channel, AI-handled versus human-handled, avoids this misread, which is how Communicate's reporting is structured.
What is the difference between escalation rate and deflection rate?
Escalation rate measures the share of conversations that move past the first line of support to a human or a higher tier. Deflection rate measures the share of conversations an AI or self-service layer resolves without a human touching them at all, a distinction the resolution rate vs deflection rate guide covers in depth, since the two metrics are frequently confused in vendor marketing.
Can a support team have a good CSAT but bad KPIs elsewhere?
Yes, and it happens often enough to be a known failure mode. A team can post strong CSAT scores while resolution time creeps up and escalation rate climbs, because CSAT surveys capture a moment of relief at contact close rather than the full arc of how long a problem actually took to solve. This is exactly why CSAT belongs in the context group rather than the decision-grade group.
Should every support KPI have a target?
The four decision-grade KPIs should each have a real, team-specific threshold that triggers a review when crossed. The six context KPIs are better tracked as trends over time than pinned to a hard target, since chasing a fixed CSAT or NPS number tends to produce gaming behavior, like agents closing tickets prematurely to protect a survey score, rather than genuine quality improvement.
How do I know if my KPI dashboard has too many metrics?
If a weekly review takes longer than fifteen minutes and ends without a clear action item, the dashboard likely has too many equally weighted rows. A useful test is asking which metrics actually changed a decision in the last month. Most teams find the answer is two to four numbers, which is the core argument behind ranking KPIs by decision weight instead of listing them alphabetically.
What is cost per ticket used for beyond budgeting?
Beyond budgeting, cost per ticket is the number that justifies or kills a tooling investment, including an AI agent deployment, because it converts every other KPI into a figure a finance team will actually read. A team that can show cost per ticket falling while resolution time and escalation rate hold steady has a defensible case for the investment that drove the change.
Do these KPI rankings apply to every industry?
The four decision-grade KPIs, first response time, resolution time, escalation rate, and cost per ticket, generalize well across industries because they measure the mechanics of a support operation rather than industry-specific behavior. The exact thresholds for each metric should still be set against your own channel mix, customer expectations, and issue complexity rather than copied from a benchmark built for a different industry.